New Listings and Pending Sales
216, Water Street,Excelsior MN 612-275-9734
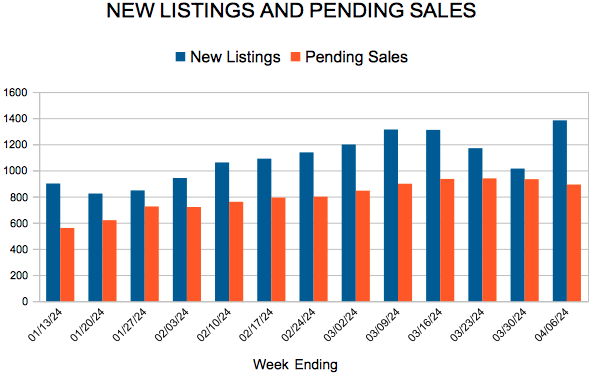
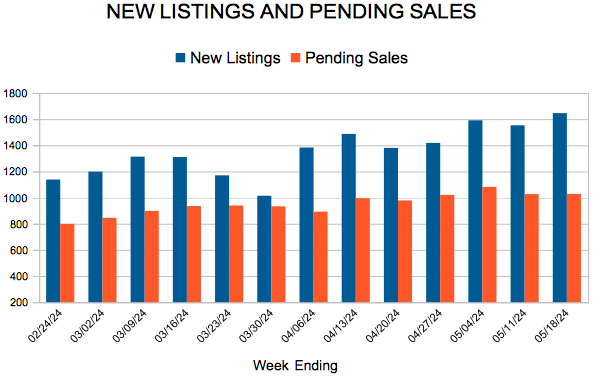
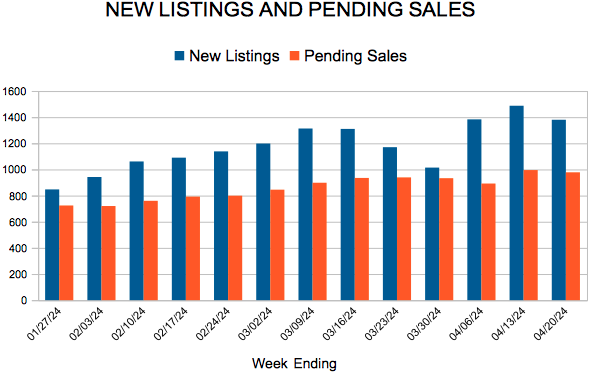
Listings are up more than sales meaning buyers are seeing more options
(May 15, 2024) – According to new data from Minneapolis Area REALTORS® and the Saint Paul Area Association of REALTORS®, both listings and sales rose compared to last year at this time. Prices and inventory levels were also higher.
Sellers, Buyers and Housing Supply
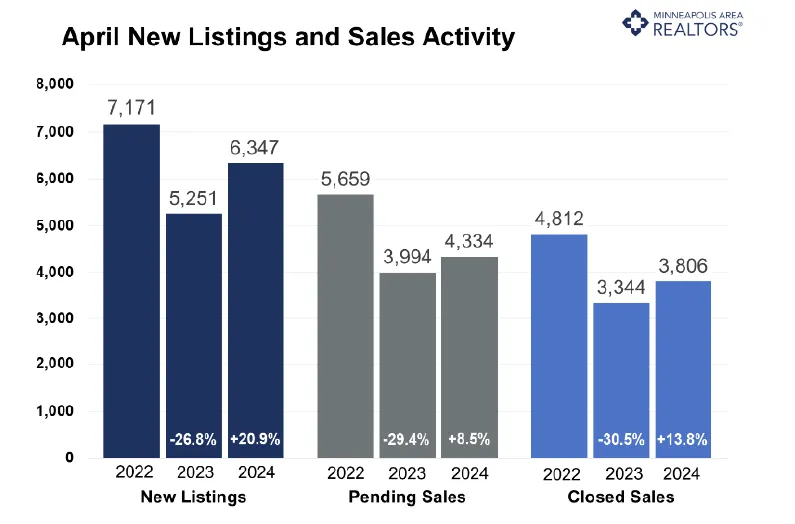
(May 15, 2024) – According to new data from Minneapolis Area REALTORS® and the Saint Paul Area Association of REALTORS®, both listings and sales rose compared to last year at this time. Prices and inventory levels were also higher. Sellers, Buyers and Housing Supply May and June tend to be the busiest times of year for buying and selling homes. This year has seen growth in both listings and sales compared to 2023. Through April, seller activity is up 19.3% while buyer activity is up 9.1%. For April alone, those figures are 20.9% and 8.5% respectively. Since listings are rising faster than sales, inventory levels are on the rise, recently up 14.1% to 7,705 active listings. That’s the highest number of actively marketed listings since November. While buyers are still feeling squeezed by rates just over 7.0%, pent-up activity for both buyers and sellers is being released as we’re comparing to an already low baseline.
Even with that increase in inventory, we’d need about 20,000 active listings to have a balanced market and we have under 8,000. But not all price points behave the same. There are 1.6 months of supply of homes under $250,000 but 6.2 months of supply of homes over $1 million (4-6 months is balanced). Move-up buyers with built-up equity from their first home are able to roll that into the next property, while first-time buyers don’t have that luxury. So, the most affordable price points have seen the largest declines in demand—but that’s also a result of having the tightest supply levels. Luxury buyers are less impacted by rates and therefore the upper price ranges are seeing the largest gains in demand. Some well-capitalized buyers are combating higher rates by skipping the mortgage entirely and using cash. About 17.5% of Twin Cities homes are purchased in cash but it’s nearly double that for properties over $1 million.
Prices, Market Times and Negotiations
Again, depending on price point, well-presented listings in many areas are getting multiple offers. Overall, sellers accepted offers just shy of full list price (99.9%), which was actually down a hair from last year. Moreover, they got those offers after an average of 45 days on market, which was faster than last year. That also varied by price point and area. Single family homes are selling after 43 days but condos are taking 74 days. “This is a market where both sides really can be successful with their needs but may not get all of their wants,” said Jamar Hardy, President of Minneapolis Area REALTORS®. “It’s okay to be excited about more inventory, but people should know that we still have an undersupplied market which means sellers have the advantage overall.”
The median home price was up 4.1% to $385,250. Single family prices stood at $425,000, condo prices hovered around $217,000 and townhomes checked in at $312,000. New home prices are just shy of $500,000 while existing home prices are $370,000. Even as prices remain firm, some sellers are finding themselves paying closing costs or doing other buyer incentives to get transactions across the closing table. “While we don’t have enough homes for everyone who wants one, I am seeing more traffic at open houses and additional buyers are coming into (or returning to) the market,” said Amy Peterson, President of the Saint Paul Area Association of REALTORS®. “Many buyers are more cautious and realistic today, yet they are still excited to become homeowners.”
Location & Property Type
Market activity always varies by area, price point and property type. Existing home sales rose faster than new home sales. Condo sales rose nearly three times as much as single family. Sales over $500,000 rose at six times the rate of sales under $500,000. Cities such as Robbinsdale, Columbia Heights and Corcoran saw among the largest sales gains while Forest Lake, Victoria and Delano all had notably weaker demand. For cities with at least five sales, the highest priced areas were Medina, Lake Elmo and Orono while the most affordable areas were Red Wing, Mora, Columbia Heights and Faribault.
March 2024 Housing Takeaways (compared to a year ago)
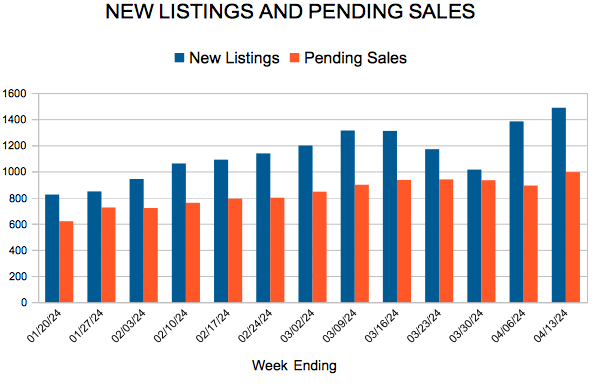
(Apr. 15, 2024) – According to new data from Minneapolis Area REALTORS® and the Saint Paul Area Association of REALTORS®, both buyer and seller activity rose in March. Inventory levels and prices were also higher.
Sellers, Buyers and Housing Supply
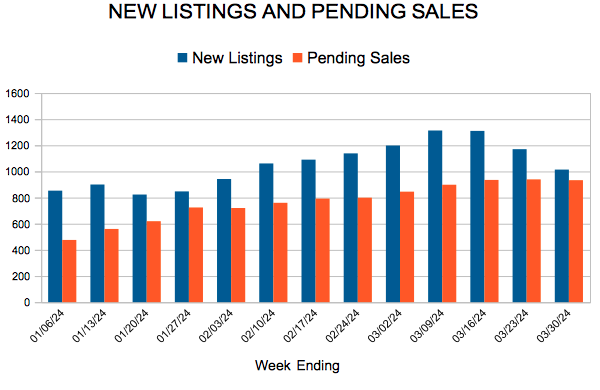
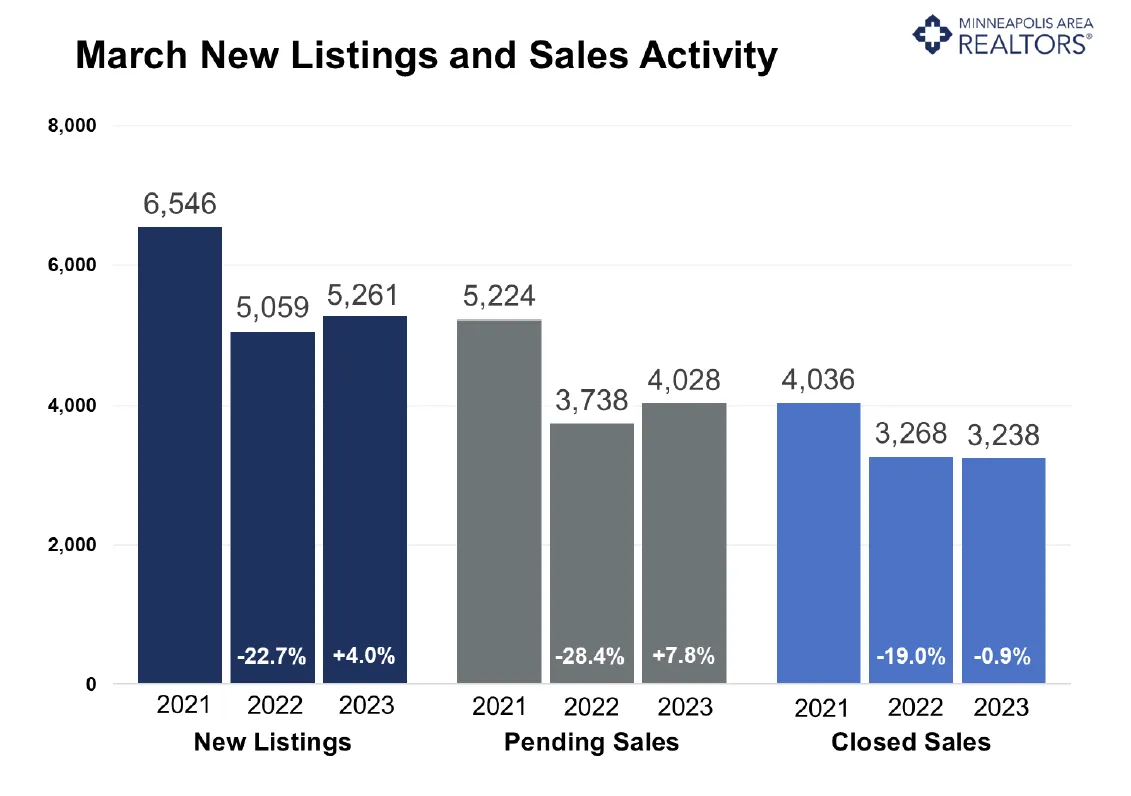
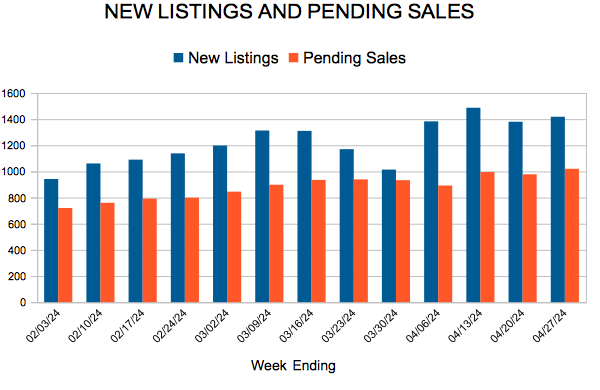
With warmer temperatures comes heightened home buyer and seller activity. Metro-wide, we’ve now seen five consecutive year-over-year increases in new listings and four consecutive increases in pending sales. During the first quarter (YTD), seller activity rose 17.9% while pending sales were up 9.4%. That’s allowed inventory levels to also rise—most recently up 8.4% to 6,879 active listings. While buyers can expect to see more listings in their searches, most areas and sub-markets still favor sellers. There is a good amount of pent-up activity from buyers and sellers that’s been accumulating from when rates jumped. The backlog is starting to be released as more consider making a move. In some ways, residents of the Twin Cities are adjusting to the higher rate environment, but low supply and rising prices combined with higher rates have held back too many from homeownership—particularly first-time buyers without the equity from their first home. Move-up buyers and those looking at pricier segments are less rate-sensitive and so activity is rising more quickly higher up on the price spectrum.
Prices, Market Times and Negotiations
Perhaps surprisingly, REALTORS® still report multiple offer situations in some markets and price points. If rates were to ease further toward 6.0%, that will continue. Listings spent 6.9% fewer days on market compared to last March. And sellers accepted offers at 98.8% of their asking price, up 0.2% from last year. “It’s clear that people are ready and eager to get deals done,” said Jamar Hardy, President of Minneapolis Area REALTORS®. “But even a few months of increases in available listings doesn’t mean the housing shortage is behind us. We’re still having to be persistent, strategic and creative when it comes to getting people into homes.”
Supply levels are too low for prices to fall but rates are too high for prices to rise much. The median home price in March was up 2.8% to $366,000 which amounts to $208 per finished square foot. During the month, sellers accepted offers on their listings after an average of 54 days (median of 24) compared to 58 days last March. Sellers are still in a relatively strong position, but some are having to make concessions by way of a price reduction, seller paid closing costs and other incentives.
“We’re in a unique place. The market remains tight even as we see it loosening a bit with more inventory and more buyers coming out to shop,” said Amy Peterson, President of the Saint Paul Area Association of REALTORS®. “A market like this is never monolithic. Every price point, segment and area are different—sometimes very different. That’s why it’s important to partner with an experienced real estate professional.”
Location & Property Type
Market activity always varies by area, price point and property type. Existing home sales rose faster than new home sales. Single family sales rose while condo and townhome sales declined. Sales over $500,000 rose at over five times the rate of sales under $500,000. Cities such as Robbinsdale, Columbia Heights and Corcoran saw among the largest sales gains while Forest Lake, Victoria and Delano all had notably weaker demand. For cities with at least five sales, the highest priced areas were Medina, Lake Elmo and Orono while the most affordable areas were Red Wing, Mora, Columbia Heights and Faribault.
March 2024 Housing Takeaways (compared to a year ago)