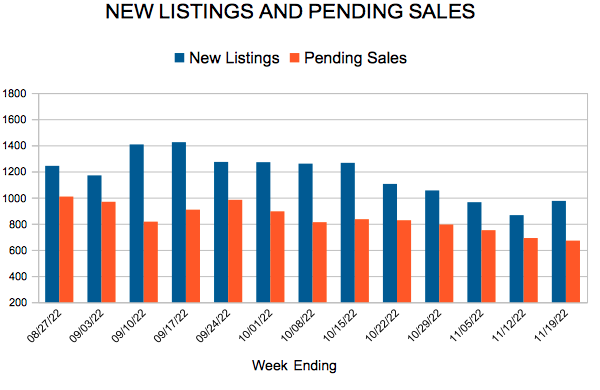
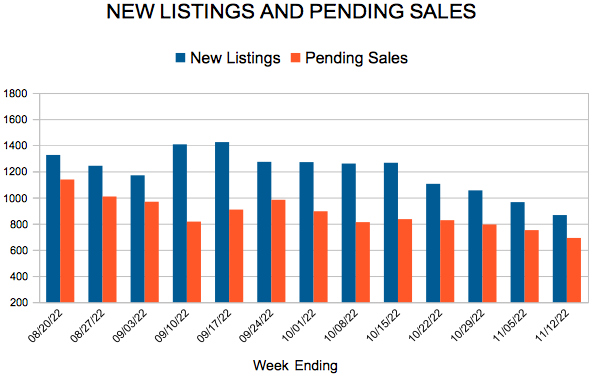
New Listings and Pending Sales
216, Water Street,Excelsior MN 612-275-9734
 For Week Ending November 19, 2022
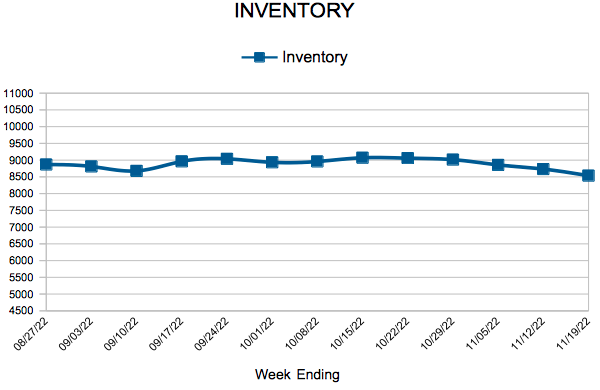
Housing supply continues to grow nationwide, as higher borrowing costs cause home sales to slow. According to Realtor.com’s Monthly Housing Market Trends Report, the national inventory of active listings increased 33.5% year-over-year in October, the highest inventory level since 2020. As a result, local buyers may find they have more options to choose from, and with homes spending more days on market compared to the same period last year, a bit more time to shop around as well.
IN THE TWIN CITIES REGION, FOR THE WEEK ENDING NOVEMBER 19:
FOR THE MONTH OF OCTOBER:
All comparisons are to 2021
Click here for the full Weekly Market Activity Report. From MAAR Market Data News.
November 23, 2022
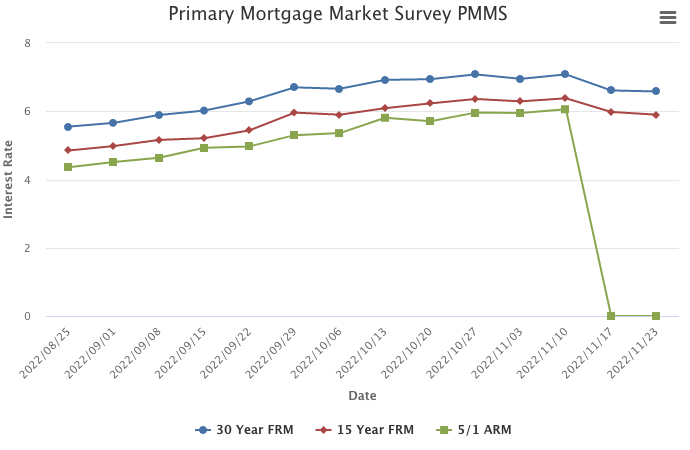
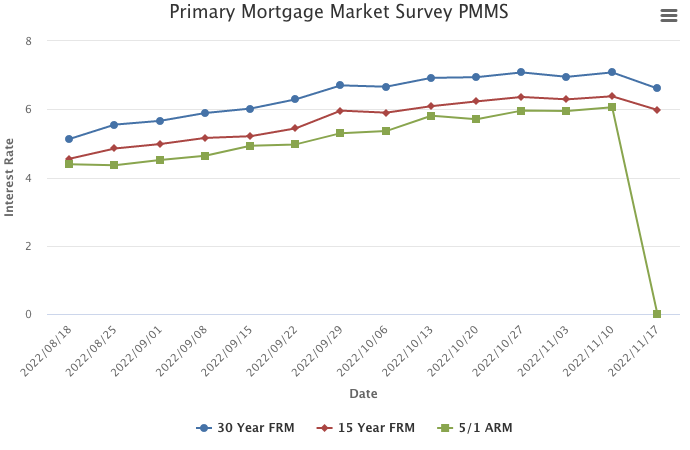
Mortgage rates continued to tick down heading into the Thanksgiving holiday. In recent weeks, rates have hit above seven percent only to drop by almost half a percentage point. This volatility is making it difficult for potential homebuyers to know when to get into the market, and that is reflected in the latest data which shows existing home sales slowing across all price points.
Information provided by Freddie Mac.
 For Week Ending November 12, 2022
Homeownership was up slightly in the third quarter of 2022, with the percentage of owner-occupied households rising 0.6 points from the same period last year to 66% nationally, according to Federal Reserve Economic Data (FRED). The homeownership rate has continued to increase despite higher sales prices and a significant increase in mortgage rates this year, illustrating that buyer demand persists, especially in markets where the median listing prices were below the national median.
IN THE TWIN CITIES REGION, FOR THE WEEK ENDING NOVEMBER 12:
FOR THE MONTH OF OCTOBER:
All comparisons are to 2021
Click here for the full Weekly Market Activity Report. From MAAR Market Data News.
November 17, 2022
Mortgage rates tumbled this week due to incoming data that suggests inflation may have peaked. While the decline in mortgage rates is welcome news, there is still a long road ahead for the housing market. Inflation remains elevated, the Federal Reserve is likely to keep interest rates high and consumers will continue to feel the impact.
Over the last fifty years, Freddie Mac has closely monitored the trajectory of mortgage rates. This week we are launching enhancements to our Primary Mortgage Market Survey® methodology that will increase its accuracy and reliability. This new approach will incorporate more detailed data and monitor real-time mortgage rates more closely.
Information provided by Freddie Mac.
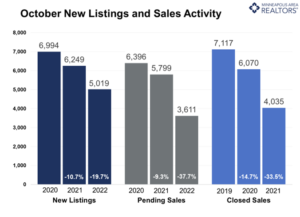
(November 15, 2022) – According to new data from Minneapolis Area REALTORS® and the Saint Paul Area Association of REALTORS®, pending sales were down by over a third in October compared to last year. The decline in buyer activity is largely a response to increased mortgage interest rates and many completing purchases in the last couple years. Meanwhile, home prices continue their ascent.
SALES & LISTINGS
Several rate hikes by the Federal Reserve have had their desired effect: to slow borrowing activity and slow the demand for capital. This has significantly cooled home sales activity across the nation, including in the Twin Cities. In October, buyers saw their mortgage interest rates increase to 7.1 percent, a 20-year record. Facing higher monthly payments (about 35.0 percent higher), buyers were reluctant to sign contracts. Pending sales fell 37.7 percent to 3,611 purchase agreements and 4,035 transactions closed, down 33.5 percent. The Twin Cities has not seen a year-over-year decline in demand this substantial since the summer of 2010.
“We quickly forget how the last two years were extraordinary and historic years for housing. There will always be a lull after that. But these rates are exacerbating this,” according to Denise Mazone, President of Minneapolis Area REALTORS®. “The reality is that this is a more typical market but doesn’t feel that way compared to the last few years. Sellers getting 104.0% of their list price in 4 hours with 40 offers is neither normal nor sustainable.”
Seller activity was also down as many hesitated to become buyers and trade in their favorable rates for higher payments. Softer demand has meant homes spend more time on the market—36 days on average or nine days longer than last October but one day longer than 2020. Sellers listed 5,019 properties on the market, 19.7 percent fewer than this time in 2021. Those that did list tended to accept a smaller share of their asking price, averaging 98.2 percent of list price.
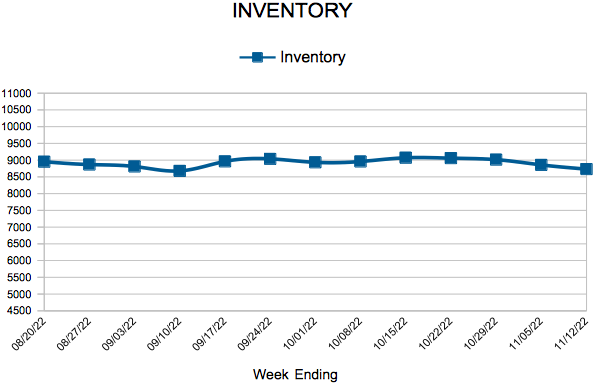
INVENTORY & HOME PRICES
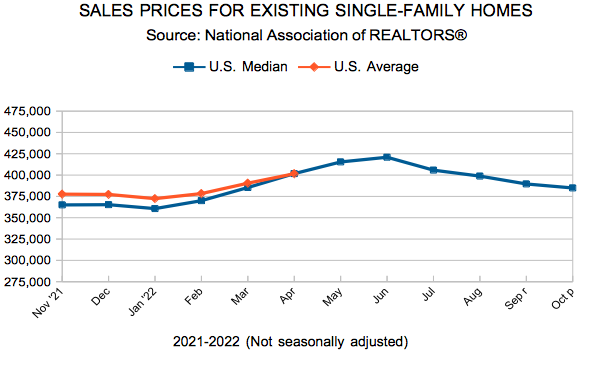
The median home price in the Twin Cities increased by 4.7 percent to $356,002. While up, the increase is down from some double-digit price gains in 2020 and 2021. In fact, it’s the smallest increase since the onset of the pandemic. Although the rate of price growth is slowing, prices continue rising as both the homes and buyers in the market skew toward higher price points. Inventory levels remain tight despite the recent shifts toward a more balanced market. The softening in demand has been met with a similar decline in new listings, keeping the balance relatively tight.
“Between changing rates, inflation, an election and a possible recession, there’s a lot of uncertainty in the air right now,” said Mark Mason, President of the Saint Paul Area Association of REALTORS®. “Despite all that, our region still has thousands of eager buyers every month searching for their next home.” October ended with 8,756 homes for sale, 5.1 percent more than last year. Weaker buyer activity has shifted our industry back towards a more balanced marketplace (4-6 months of supply), but buyers should understand we are still in a seller’s market. Month’s supply of inventory rose 26.7 percent to 1.9 months.
LOCATION & PROPERTY TYPE
Market activity varies by area, price point and property type. New home sales fell 18.3 percent while existing home sales were down 33.8 percent. Single family sales fell 32.2 percent, condo sales declined 36.4 percent and townhome sales were down 33.1 percent. Sales in Minneapolis decreased 30.0 percent while Saint Paul sales fell 33.4 percent. Cities like Corcoran, Elko New Market, St. Paul Park and Belle Plaine saw the largest sales gains while Princeton, Centerville, East Bethel and North St. Paul all had notably lower demand than last year.
For more information on weekly and monthly housing numbers visit www.mplsrealtor.com or www.spaar.com
OCTOBER 2022 HOUSING TAKEAWAYS (COMPARED TO A YEAR AGO)