New Listings and Pending Sales
216, Water Street,Excelsior MN 612-275-9734
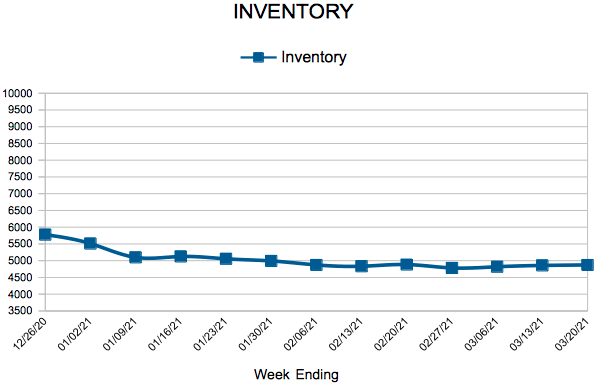
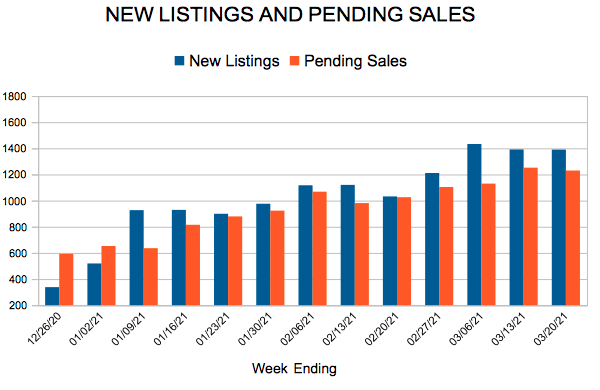
 For Week Ending March 20, 2021
Real estate data firm ATTOM Data Solutions reported that the number of homes flipped by investors decreased in 2020 for the first time since 2014. For this study, ATTOM defined a home flip as a condo or single-family home that sold twice within 12 months. Flips of single-family homes and condos fell 13.1% in 2020 compared to 2019, falling to its lowest point since 2016. ATTOM estimated that 5.9% of all homes sold in 2020 were flips.
In the Twin Cities region, for the week ending March 20:
For the month of February:
All comparisons are to 2020
Click here for the full Weekly Market Activity Report. From MAAR Market Data News.

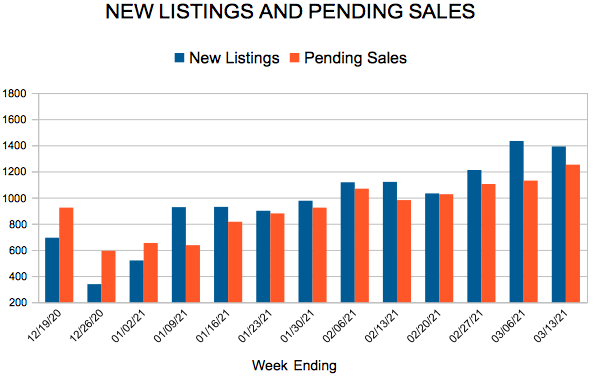
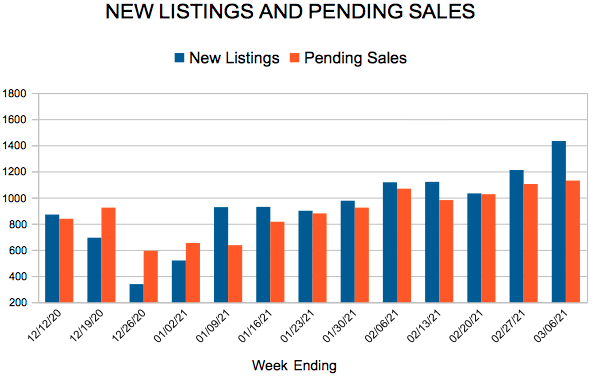
 For Week Ending March 13, 2021
Freddie Mac reported that cash-out refinancing activity surged 42% in 2020 compared to 2019, as homeowners cashed out $152.7 billion in home equity, the highest level since 2007. Low interest rates and strong appreciation in recent years proved attractive to cash-out refinance borrowers, who, on average, withdrew $50,000 in equity.
In the Twin Cities region, for the week ending March 13:
For the month of February:
All comparisons are to 2020
Click here for the full Weekly Market Activity Report. From MAAR Market Data News.
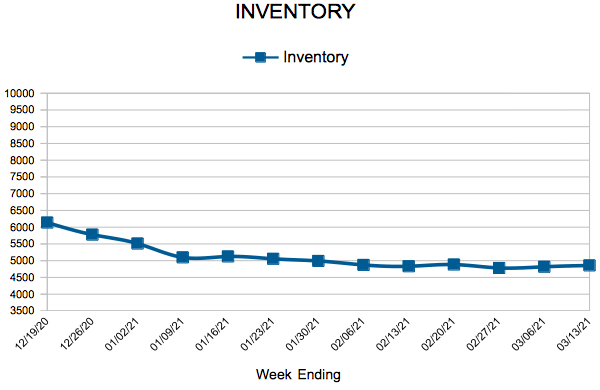
Mortgage interest rates ticked a bit higher in February, but remain below their February 2020 levels.
(March 17, 2021)
– According to new data from the Minneapolis Area REALTORS® and the Saint Paul Area Association of REALTORS®, sales activity in the 16-county Twin Cities metro continues to climb above 2020 levels while the number of signed purchase agreements flattened out. Closed sales rose 4.8 percent from last February, which was the highest figure since at least 2003. While new signed purchase agreements were also the strongest since 2005, they were down 0.1 percent from last year, suggesting low supply could be constraining sales.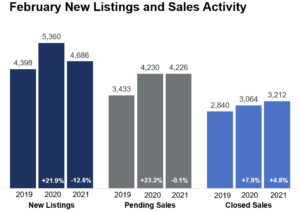
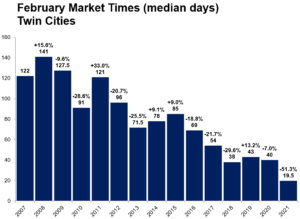
The number of homes for sale in February was down 46.3 percent compared to a year ago. That amounts to 0.8 months of supply, while a balanced market has 4-6 months of supply. At 100.1 percent of list price, sellers are still benefiting from historically strong offers, often over asking price and with multiple bids. Homes are selling in record time—half the listings in February sold in under 19.5 days. Home prices rose notably, up 11.5 percent from last February. Historically low rates can partly offset rising prices.
“With so many buyers vying over a shrinking pool of listings, well-priced and well-staged homes don’t spend much time on the market,” said Tracy Baglio, President of the Saint Paul Area Association of REALTORS®. “That means buyers have to come out swinging right out of the gate with their best offer in order to be successful.”
Though pending sales were down 0.1 percent metro-wide, they were up 23.3 percent in Minneapolis and 8.4 percent in St. Paul, indicating buyer interest remains strong in the urban core. Condos also saw the strongest demand growth in both pending and closed sales. New construction sales rose 32.5 percent compared to a 2.6 percent increase for previously owned homes. Sales of luxury properties ($1M+) have been strong—up 53.1 percent from last February.
February 2021 by the numbers compared to a year ago